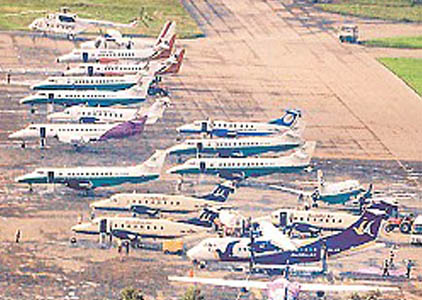
Kathmandu, July-23 Nepal’s domestic air passenger movement continued to shrink for three straight years, dropping 6 percent in 2014, as high fares, bad weather conditions and a slowed economy dented demand, according to the data of Tribhuvan International Airport (TIA).
TIA’s statistics showed that domestic carriers received 92,046 less flyers last year. These airlines carried 1.45 million passengers in 2014 against 1.54 million the year before. The figure includes the 26,256 passengers flown by seven domestic helicopter companies.
Airline officials termed the steady decline a worrying scenario as airline seat demand could dive further by at least 20 percent this year due to the earthquake that prompted a mass departure of tourists and an economic slump which has led Nepali travellers to opt for ground transportation.
As per the Post-Disaster Needs Assessment, domestic airlines reported revenue losses of about Rs400 million during the month following the earthquake.
Passenger movement has been on a constant decline since 2012 marking a departure from the robust growth rates since 2008 when airlines were flying high due to competitive airfares, road blockades and increased NGO/INGO staff movement after the peace process and a real estate boom.
Airlines saw a robust growth of 13 percent in 2008 which jumped to 33 percent in 2009 as they cut fares amid stiff competition. Although passenger movement increased 12.83 percent in 2010, the growth rate started dropping in 2011 and has shown a negative growth since 2012.
The Nepali skies saw 68,536 flights during the review period, a drop of 0.78 percent. According to the stats, an average of 188 domestic planes took off and landed at TIA daily.
“Obviously, high airfares could be one of the major contributing factors behind the sharp fall in passenger movement,” said Ghanashyam Acharya, spokesperson of the Airlines Operators Association of Nepal. “Last year, due to climbing fuel costs, airlines had frequently increased their fuel surcharge and its impact was visible on passenger occupancy.”
Airline officials said that as fuel accounts for 30-35 percent of the total operating costs, it becomes the single biggest factor in losses if the fuel surcharge is not raised. Besides, domestic carriers suffered a huge number of flight cancellations last year due to bad weather resulting in a decline in the number of fliers, airline officials said.
Acharya said that demand for air seats this year too had fallen sharply due to the April 25 earthquake that has slowed the economy. “However, airlines are cautiously looking at the upcoming festival and tourist season to recover from the low occupancy,” he added.
Three major airlines—Buddha Air, Yeti Airlines and Tara Air—suffered a sharp decline in passenger numbers.
Buddha saw its passenger carriage decline 10.34 percent to 799,958 in 2014. Yeti Airlines saw its passenger movement drop 7.73 percent to 409,042. Yeti’s subsidiary Tara Air, which only operates on remote sectors, observed negative passenger growth of 5.90 percent. It flew 77,020 passengers last year.
However, Simrik Airlines, Nepal Airlines and Sita Air saw healthy passenger growth in the review period. Simrik received 82,131 passengers, up 17.68 percent, and Sita Air received 11,353 passengers, up 33.43 percent from last year.
The national flag carrier Nepal Airlines saw the strongest passenger growth after it received two Chinese-made MA60 and Y12e aircraft in April and November respectively last year. TIA’s statistics showed that Nepal Airlines passenger occupancy swelled 69.87 percent to 34,978 in 2014.
Passenger movement – 2014
Airline No of flyers Change
Buddha Air 799,958 -10.34%
Yeti Airlines 409,042 -7.73%
Tara Air 77,020 -5.90%
Simrik Airlines 82,131 17.68%
Nepal Airlines 34,978 69.87%
Sita Air 11,353 33.43%
Goma Air 6,417 —
Year-wise figures
Year No of flyers Change
2005 1.11m 26.80%
2006 0.88m -20.50%
2007 0.91m 3.80%
2008 1.03m 13.10%
2009 1.37m 32.9%
2010 1.55m 12.83%
2011 1.58m 1.85%
2012 1.57m -0.55%
2013 1.54m -2.06%
2014 1.45m -5.96%
(Source: TIA)
Source: The Kathmandu post


